Top Complaint: How Can I measure #SocialROI

We came across this MediaPost article, “You’ll Never Guess Social Media Marketers’ Top Complaint”, and thought maybe we can help. Overall it’s a great read and think you should dig into it before reading our thoughts below.

So it’s true, right now as we come into a decade of using Social Media and Digital as a pertinent part of the marketing mix most brands and companies are still struggling to define and figure out their Social ROI. It’s interesting that it’s taken us this long to really nail this but this should be an easy one folks. With the change from traditional, direct and print marketing many of our key values and metrics are the same and figuring them out is almost the same. Just as before when you measured the amount of views or impressions on a magazine ad, now you can look at those some metrics on your Facebook post. The nice part is your images are being put in front of your audience much more frequently and offer a chance for them to engage. Not only can you look at impressions but now you can see if anyone took an action such as a like, click or comment. These values should be much more valuable and can be rated higher.

HubShout’s Full Infographic:http://hubshout.com/?2015-Social-Media-Stats-Infographic&AID=1656#.VYHkWFX3_Gf

With similar business objectives as to before along with similar values it should be easy to plug in some numbers so you can decide what actions by users might be worth. From there taking into account any expenses (ads, SEO, team costs, etc) you can calculate your ROI.  We even outlined these steps in one of our blog posts awhile ago. However with the amount of items and varying levels of relationships with users through Social Media this can be incredibly cumbersome. What’s more once you have it all figured out, how do you know which of those posts or numbers may have been better so you can keep doing it? Or how do you know that Tuesdays, for example, was the best day to post? Tricky.


So, If at least 60% of marketing professionals are struggling to figure out their ROI then I guess we are doing something right. We built LiftMetrix to empower marketers to act on their social media analytics without having to spend hours in spreadsheets or hire data teams. Get a free trial today, chat with one of our team members or share your thoughts below!


Read More

4 Thoughts you have when creating Facebook videos for your Brand Page

Facebook videos have been an offering for users and brands alike giving a native functionality to include videos within your Facebook presence. While there are tons of other video platforms you can use, which are often still extremely beneficial to your brand, don’t count out using Facebook videos. When talking about videos we understand the time and effort it might take to produce something even if it is just a short video, but overtime more and more brands are seeing the ROI in Social Media videos. However, you might be thinking…


Thought 1: Why Videos?

“Video is one of the most engaging and immersive ways to tell your story. Whether capturing breaking news, a baby’s first steps, or rising to a friend’s challenge for charity, it is a remarkable storytelling medium.” (The Latest on Facebook Video)

Videos are becoming more and more popular and have become a great way to engage easily with your audience while providing a bigger window into your brand. Not only does it give you the ability to create better branded content and engage with your core users but it gives the users something more and a greater connection with you. Facebook has shown that video videos grew over 50% over last year and 65% of video views were happening on Facebook.


via Facebook


Thought 2: Why do I have to create different video files to have a Facebook Video?

The honest answer is because that’s the game we have to play if we want to do it right and maximize our success (& ROI) on Facebook as well.

In September, with some new features releasing, Facebook released this in an article:

After introducing videos that start playing automatically in News Feed earlier this year, we’ve found that people discover significantly more content with this feature. And when used in combination with our new video views objective, businesses are seeing a significant decrease in cost per view for their Facebook video ads.”


via VentureBeat


If that isn’t enough, VentureBeat broke down the differences and metrics among the various types of video platforms showcasing the Facebook vs YouTube debate in this recent article. Through their study they went to brands to understand what was most important when measuring their video results and at the top of the list was “engagement, shares, conversions, and total time spent watching.” Although YouTube offers great SEO helping to drive views to videos, Facebook provides a much better environment and opportunity for users to engage and share.


via VentureBeat


Thought 3: Where do I even find the analytics for my Facebook Videos?

Once you’ve posted your first video you will certainly want to measure and analyze the results but those analytics look a bit different than your status, link or image posts. However if you are familiar with the insights tool you should easily find them. If not, to see metrics about a video shared from your Page:

  1. Click Insights at the top of your Page
  2. Click Posts
  3. Scroll down to All Posts Published
  4. Click the post you want to see metrics about (To easily spot look for the video icon under “type”)
  5. From the Post Details window, click Video


via Ad Week


Thought 4: What do these numbers mean?

There are quite a few metrics you may find the top three to pay attention to are below:

  • Video Views – A view of 3 seconds or more of a video. You can also see the portion of your video views driven by paid advertising.
  • Unique Video Views – The number of people who viewed your video for 3 seconds or more. You can also see the portion of your unique views driven by paid advertising.
  • Average Duration of Video Viewed – The average amount of time people spent viewing your video.


Alright, so now that you have the scoop on Facebook videos, let’s see what you’ve got! And if you need a bit more incentive to get started on your next Facebook Video campaign, we love these engagement tips from Social Media Examiner.


Read More

300 Million People at Your Fingertips (Instagram for Brands)

At the cost of $1 Billion a couple of years ago, Instagram is still growing and trending around the world. It has become a necessity for brands and users alike on social media even with the limited ad options. The visual focus, simplicity and popularity of the app itself combines to make a powerful platform for brands. It’s all in the way you use it. We’ve put together a few topics that make Instagram what it is and to showcase some of the best ways to leverage the platform as a brand.

via Instagram

Statistics:
A LinkedIn user, Katy Elle Blake, prepared a list of all the Instagram facts you need to know for 2015. While she covered a full array, we pulled together what we thought were the most useful for our audience but we encourage you to read the full report.

  • Instagram currently has 300 million monthly active users.
  • 75 million of those use Instagram every day.
  • 30% of teenagers consider Instagram the most important social network.20% of US adult females use Instagram, compared to 15% of US adult men.
  • 20% of Internet users aged between 16 and 64 have an Instagram account.
  • 41% of Instagram’s audience are aged between 16 and 24 and 35% are from 25-34.
  • This one might shock you - 51% of Instagram’s audience is male. 49% is female.
  • Instagram launched in October 2010. Over 20 billion photographs have been shared on the site since then. 70 million new photos are shared each day.
  • There are around 2.5 billion Instagram likes every day, or 8500 new likes each second. 1000 comments are left each second.
  • 70% of Instagram users log in at least once a day. 35% check Instagram multiple times per day.
https://instagram.com/press/

In addition to the stats specific to the platform, we found these five stats about user engagement on the app and with brands from Sprout Social incredibly useful.

  • At 4.21%, Brand Engagement Rates Highest on Instagram
  • 50% of Comments Are Posted in the First Six Hours
  • @mentions in Captions Receive 56% More Engagement
  • Adding a Location Results in 79% Higher Engagement
  • Open Backgrounds and Single Dominant Colors Return More Likes
via Sprout Social

Brand Tips:
If you are still figuring out how to use Instagram we love these tips and suggestions from B2C. Here’s the full article but we’ll highlight the items we agree with wholeheartedly. (Note highlighted experts are from the article and the remainder copy are our views).

#1: Build a community around an actionable hashtag:

    You can’t go wrong with hashtags and we strongly encourage you to choose quite a few to begin using actively to ensure you are reaching your target user. However, in addition to those it is important to have a hashtag that is your own but isn’t just a brand name. You want a user to see the hashtag, take an action and associate the action with your hashtag. There are some great examples of brands doing this out there across the board and we think Instagram is the most important platform for this.

#4: PLEASE don’t over post:

    For reach this is IMPORTANT! Although on Twitter you can post day and night, Instagram is a unique platform. For most brands posting a couple times a week is plenty so keep that in mind when planning out your content.

#7: Utilize all the tools Instagram has to offer:

    Just like any other platform, it isn’t a one way street, You never want to push content out and walk away. So just like other platforms, understand the behind the scenes including native Instagram features (filters, special effects, editing, etc), Instagram analytics tools to provide you with insight (Impressions, reach, engagement, etc) and finally Instagram’s Business team and Blog.

#8: Get inspiration from others:

    There are so many great brands out there that it is easy to see how users are responding to their content. Use their best case examples to inspire your own content. In addition see what your fans are doing and jump on board. Anytime something is picking up with a fan, even if you didn’t create it, take advantage of the momentum and loyalty they are creating.

#10: Interact with Others on Instagram to Grow Your Following:

    This one should be a no brainer if you are using any social media platforms, but it must be said. The best way to grow your audience is to be authentic and engaging. Find users who are talking about your or a relevant topic for your business. Get a conversation started, #regram their images, highlight top users, and more to garner engagement and additional reach.


Tools:
Although Instagram is still pretty closed off, there are a few tools to help in a variety of ways that we have used in the past:

Keyhole.co:This tool is used to see what hashtags are popular and find suggestions for related ones, although its really for twitter, you will find most hashtags are consistently used across both.

Tagboard: This tool lets you see what other Instagram content is being shared using the same hashtag and how often it’s used.

Iconosquare: This tool allows you to collect analytics such as average likes, your best hashtags and follower growth.


So now that you’ve got all that information, what will you do with it? We recommend getting out there and trying it out! Try everything and begin to understand what works best for your brand and resonates the most with your user base. Over time you will continue to grow your audience and be one of the top brands we keep seeing!

Read More

Prioritize Social Media Platforms For Your Brand

There are SO many social media networks out there and new ones seem to pop up everyday, just ask any teenager they are sure to know what’s new. With that said you don’t have to be on everyone of them. It’s important to understand them and find the right platform for your brand based on both industry and target audience. There are so many things to think about so we’ve broken them down for you and found some resources to get you started!

They say AGE is just a number but depending on your product or brand it can be extremely relevant to some ages and not all or vice versa. Don’t just think about “generations” as sometimes that isn’t a one size fits all either as someone in their 30s could have very different cares than someone at 25. Just an example of how different age groups feel about various platforms, check out this great overview, Social Media At Every Age. One thing I pulled from this post was that people like photos. We all know this but understanding which apps seem to be popular amongst all ages it is clear that people like easy and images. When it comes to thinking about your target audience, age can be one of the first things so take these great nuggets of Wisdom from Gabbi when thinking about the age you are targeting:

“Before launching your next campaign or creating your social media plan, take a step back. Go back to what your college professor told you to do (and how you proceeded to roll your eyes) and create an outline for your paper – with section A being audience analysis. Turns out, that professor was right.”

 Does GENDER matter to your brand? It might, especially if we are talking toiletries or makeup! This one may not always matter but when it does consider these quick facts (based on report from Business Insider December 2014):

  • Facebook still skews slightly more Female
  • Twitter has begun to lean more towards a Male audience
  • Pinterest is made up of mostly females
  • LinkedIn is slightly more popular with Men

Now what type of CONTENT do you have to share? Are you a company with tons of stats? Too many photos? A little bit of everything? Of course you can do a mix across all social networks but don’t waste your time. If you have photos they can be more powerful on networks that users expect to see them such as Pinterest, Instagram and Facebook (maybe even Tumblr!). If you have more content focused around articles or words then Twitter and LinkedIn could be the place for you.

Finally, some INDUSTRY related stuff! We found this great rundown of what different industries are doing across social media platforms. Released recently, Hubspot does a great job with “Benchmarks for 9 Different Industries”. Of course Marketing Services Industry is posting the most per week but it’s interesting to learn how valuable social media is to other industries such as Real Estate. We think this breakdown is pretty spot on so have a read on the section specific to your industry and see how you compare against others.

With all that in mind and understanding there are tons of platforms out there, narrow down which ones make sense for you. We would encourage you to pick only one or two if you are just starting out or three if you are already up and running. Most brands can benefit from doing three platforms well instead of trying to do them all. Once you start don’t stop, Social only works if you continue to stay involved.

One last thing, want some of the latest and craziest stats about social media out there? Have a quick read of these 30 Crazy Stats We Heard at Social Media Marketing World #SMMW15. (Don’t be shocked that “10. You will only get a 1-6% organic reach on your posts in Facebook. So heart-wrenching.”)


Read More

Social Media Stats To Share With Your Boss

So what should you be sharing with your boss? As we all know there are so many stats to review and analyze on a day to day basis within our social media platforms. However most of our bosses and supervisors don’t necessarily need to see all the nitty gritty. So we’ve put together the top 5 stats you should be sharing with your boss on a regular basis.

  1. Total Growth: The top number everyone wants to see is your total numbers so always pull together how many likes you have on Facebook, followers on Twitter or Instagram and so on. This number is important but it’s also important to share how you’ve gotten here. In most instances you won’t hit a million followers over night so understanding how well your numbers are increasing over time and organic vs paid.
  2. Increase in Engagement: Engagement is incredibly important but if you constantly get great engagement the number will no longer mean much to your boss. It’s important to take a look at the growth of your engagement and also the tone. If you are getting great engagement but month over month it is increasing and providing a much more positive tone then it can tell your boss a lot more about your efforts than simply staying the same.
  3. “Top” Posts (content, type, time, etc): Pull out the top posts since your last report along with providing what type of posts made up the “top”. Was there a specific type of content (photos, links, etc) or was there a topic that sparked a lot more conversation?
  4. Recent Promotions Results: If you had any special promotions since the last time you provided information to your boss it’s important to call this out. Let them know the top line numbers from the promotion and any top line learnings.
  5. Ad Spend: This is where your social roi really comes in. Not only are you looking at your total ad spend and the results generated from each platform but this is a great way to see what your ROI was for the ads and your social media efforts overall. Take the opportunity to walk through your boss on this one.

We know there are many many more stats and everyone’s team may be focusing on different things but overall these are important to any supervisor. Any stats we missed that your team likes to see?

Read More

Who said FB organic reach is dead?

Help! My Facebook organic reach is DYING!

There’s been a lot of talk in the past year about how Facebook is limiting organic reach (Tech Crunch Article) and the perception that organic activity is ‘dead’ because Facebook is becoming a “pay-to-play” channel.

Additionally, there are great articles (like this one) from the team at Buffer on how the Facebook algorithm selects valuable content over unloved content. Their blog post can help you stay current with the frequent algorithm changes. The article is great, but be warned it’s quite long. The TL;DR:

The most engaging content will be shown more often on the news feed!

A solid conclusion but brands are still left guessing as to what content they should post today or this week, to drive engagements and lift ROI.

Does your organic fanpage ROI look something like this?

unnamed

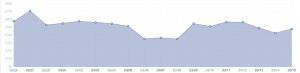
Its just humming along, sideways, so you decide to simply put more resources and money into FB ads because you’ve seen articles about Facebook becoming “pay to play” like this one (from the Guardian).

However, despite the ad spend, your organic ROI stays relatively flat, right? Some days you’re up a bit and some days you’re down without ever knowing why. You post once or twice per day as ‘maintenance’ but can’t figure out what content is going to drive a lift in engagements.

What if there was a way to break out of an ROI flat-line and experience an organic ROI spike like this?

Screen Shot 2015-03-27 at 2.33.26 PM

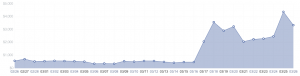
Here are the organic numbers behind the ROI spike for this brand:


Metric                       Daily avg 2/26 - 3/15     Daily avg 3/16 - 3/26      % Change
Posts Per Day                   2                    2        -
New Fans                  43                   66    +53%
Impressions               24,859                37,644    +51%
Likes                 186                  343    +85%
Shares                   8                   13    +56%
Comments                  22                   29    +31%
Website Visits               2,798                 2,993     +7%
Site Conversions                 678                  783    +15%


How did this social media team succeed across the board?! They learned what content performed the best and received content recommendations for their daily posts.

Ultimately, the ability to identify and learn from the most engaging content drove real business results: 7% more daily website visits and 15% more conversions. While Facebook has reduced the impact of organic posting, brands are still able to improve their content strategy and create a plan to accomplish their objectives.

How was this brand able to identify the content that drives real business results?

How to Analyze Your Content:

  1. First, define your goals on social media (drive sales, engagement, site visits).
  2. Experiment with a variety of post types, timing and content themes.
  3. Export your post results from Facebook and Google Analytics into excel. Merge Facebook post data with Google data using UTM parameters as the connection. (This can be tricky)
  4. Tag each post with themes or any descriptor (‘celebration’, ‘user images’, ‘pants’, ‘discount’) to classify posts by their content.
  5. Run a pivot table to determine your post theme cohorts which would help you identify if ‘black skirts’ drive higher sales than ‘dark wash denim’ over the time period.
  6. Optimize the content calendar on the next campaign reflecting this data.

There’s a couple issues with this:

  1. Bandwidth - It takes a lot of excel gymnastics to get the data you need. You may involve your data scientist or digital marketing analytics team to arrive at actual resuls. If you could do the data analysis yourself, do you have the time of day?
  2. Speed - Assuming you have the data team, how often could you connect and receive recommendations from them? One week or one month later to make the necessary adjustments simply isn’t fast enough in social.

Doesn’t sound like much fun does it?

And if you’re doing the above already, my condolences. (I could never excel in excel.)

This is the moral of the story:

Better Content -> More Engagement -> More Shares -> More Fans -> More Conversions

Finding out what content works is good for everyone. Its great for your fans and drives business results for your brand.

The faster you can make the necessary change and see what’s working for you the better. In fact, if you could estimate the engagement of a post, based on content type or theme prior to posting, wouldn’t that be useful?

And what if you didn’t have to work in excel anymore (unless you really loved it). What could you do with that time?

Shameless LiftMetrix plug: LiftMetrix can do this for you. LiftMetrix was built to help social marketers determine which post themes drive the highest ROI. LiftMetrix connects the dots to your site to measure full conversations and conducts tagging analysis to provide you with recommendations. Our customers have experienced a 20% lift in their ROI after following our plan.


Read More

Content Curation in Four Steps

Everyone says “Content is King” and really, it is for all of your digital efforts, but that doesn’t necessarily mean you need to do all the work! We think social media is for sharing and that includes content! If you see good content, leverage it! Here are 4 simple steps for content curation to amplify your existing digital efforts:

  • Get Set Up! This includes searching out industry news sites, blogs, partners and affiliates and putting together an RSS feed. There are many great tools out there such as feedly, storify, flipboard and of course is integrated into many social management software. In addition, we would recommend creating a twitter list to easily see their content on a daily basis.
  • Determine what’s relevant. Although you will see tons of great content, you can’t overwhelm your readers and followers. If you are unsure how many posts you should share per day, try using a tool such as LiftMetrix with custom recommendations including number of posts per day. It’s important to decide what’s relevant to your users and what you want to share. In addition, make sure you have an opinion on things you share as well. Again think about using tools or analytics to see how your users engage and leverage your entire team to come up with a list of requirements to decide relevant content.
  • Prepare to share :) When sharing content, not only do you want to get it out but also add your opinion or a reason to share. Either write your opinion within your social copy or add more through your blog, but always, always give credit to the original author including linking or tagging on social.
  • Organize and Track! This is always the end of any process…but maybe the most important. When posting and tracking, add keywords or tags and understand what types of content are working the best with your audience. From there adjust your strategy from #1 based on your findings. Within LiftMetrix you can add tags to posts and then receive insights and recommendations based on these keywords.

There are tons of great tools out there to help with your content curation, scheduling and posting, such as one of our partners Hootsuite. See our blog post on the integration here. We’d love to hear which ones you use and prefer in the comments below!

Read More

Five Simple Ways to Improve Twitter Engagement

We must admit we’ve been so focused on everything else, including our new website, version 2.0 and our recent integration with HootSuite that we haven’t put much focus on Twitter.  Now that we are full steam ahead we are back at it and thought we would share some simple techniques we have been using to boost our followers and increase engagement:

    1. Personality in your content can go a long way. Being personable, adding some sass and humor will get people to follow and engage. Use your copy as the voice of your brand and your followers will not only feel they can relate but also want to talk to you. Some simple changes could help you stand out in the clutter of information!
    2. Hashtags, Hashtags, Hashtags! Need we say more? Well we will :) Hashtags can help you categorize your brand and your message whether it is related to your products, services, etc and add value to say what you are offering your audience. Not only does it help your followers engage but it will help you appear in other related conversations happening on Twitter.
    3. Add Images to your copy. Including a visual that users can’t scroll past will encourage them to interact through a RT, reply or click. Just make sure that image is related to your content so you are driving quality interactions.
    4. Use actionable words so that users know what you want them to do. This is especially important when thinking about what your objective is, such as click for a free trial, download now, etc. Twitter has even stated that using actionable words will increase clicks by 13 percent on average.
    5. Check the Time! Most audiences are more engaged and active at nights and on weekends so watch your audience and tweet when they are watching.  There are lots of great tools (including LiftMetrix) that will give you valuable metrics to ensure you are engaging when your target audience is watching.


What tips or tricks do you use to jump start your engagement?

(Oh and don’t forget to give us a follow @LiftMetrix!)

Read More

HOW E-COMMERCE COMPANIES CAN DRIVE SALES WITH PINTEREST


When it comes to E-commerce the goal of any digital marketing strategy should be to drive traffic, improve conversion rates, and sell products. The recent rise in popularity of social media websites, like Pinterest and Facebook, has provided online businesses a new and improved way to turn website traffic into sales. Pinterest is a social media platform that can no longer be ignored. Its staggering growth has made it a popular website for E-commerce companies to use for increased traffic and higher sales. For online businesses that are trying to use social media in the most effective way possible, there many ways to drive sales with Pinterest and take advantage of the free flow of converting traffic it can provide.

Many social media marketers are aware of how beneficial Pinterest is and have begun capitalize on it. The site is still in its infancy and has a lot more room to grow.  When it comes to targeted web traffic Pinterest is still virtually untapped. The first thing to remember in order to drive more sales with Pinterest is that the majority of users are already in a buying mindset and are simply browsing products looking for inspiration. With this in mind it’s important to have all products and services clearly displayed and optimized. Ideally optimized product and landing pages are highly converting and will encourage website visitors to share the content. Not only does this mean more sales are possible but the more that the content gets shared the more traffic can be driven to your website.

After optimizing the landing and product pages the next step is to improve general on-page SEO and make the e-commerce website and Pinterest page more user-friendly. When it comes to driving sales and attracting customers a variety of SEO methods must be used. Some effective methods include adding a detailed “About” section, using high quality images, and using the right targeted keywords in all content. Users will tend to visit your Pinterest page looking for high quality images and valuable information. By filling out the product and pin descriptions in detail random but relevant keywords will be targeted. Detailed descriptions also provide a lot of value to the visitor, which is great for SEO. Using all of these methods and techniques will increase the amount of web traffic reaching an e-commerce site and result in more sales. It’s suggested to use Google Analytics to track the habits of visitors to any website. Analytics will tell a Webmaster where the website traffic is from, how long any traffic is visiting a website, and whether or not it’s clicking your sales links.

Another feature of Pinterest that’s often overlooked, but can is often used to drive sales, is the level of customer interaction and engagement that the website provides. E-commerce companies are now provided with a forum to converse and build relationships with customers and the people interested in their products. Since each product will be listed with a high quality image it becomes a lot easier for online discussion to flourish and for e-commerce companies to participate. This is in stark contrast with social media websites like Facebook where it’s only possible to talk about one product or service at a time and where anything important will get pushed down the page. Customers that can get answers and interact with online businesses are more likely to purchase a product that company has for sale. With the current state of online sales it’s safe to say that e-commerce businesses are now competing on value rather than price and the more value you provide the customer the more sales will be made.

While Pinterest has already exceeded every other online social media platform when it comes to e-commerce sales, conversions, and targeted buying traffic the platform is still only beginning to grow. Pinterest has many years of expansion ahead and for now it remains a great market for e-commerce businesses to expand into.  Using Pinterest to gain website traffic and drive sales is one of the most important factors of sustainable long-term growth and for e-commerce businesses this is the key to success.

Have your own tips or tricks for leveraging Pinterest? Leave them in the comments for our readers!


BANNERA_guide_to_Mastering_Social_ROI (1)


Read More

DESK-Blog-1024x526

Get More out of Twitter


Looking to increase your followers? Wondering how to get more Retweets, Replies and Favorites?

Here are 3 tips to help you get better results on Twitter:

1. Choose the right times to post.

Most analytics companies will tell you to post during lunch and after 5pm, when the workday is over. Instead, we would recommend testing 3-4 different times per day to post and measuring the results. Continuously test different post times, types of post and different keywords in your post to continuously optimize your plans. As your followers grow, your results will likely shift so test, test, test.

2. Don’t just push out content and cross your fingers.

Think about the types of posts. There are 3 main categories of posts: links, images and comments. Consider the outcome you desire and use the appropriate type of post.

Links – Use high quality content to drive traffic to your site and gain new followers and retweets.

Images – Post compelling images to increase engagement with your followers.

Comments – Comments allow you to engage with followers as if you are speaking with them directly.

3. Mention other brands and individuals with their @handle.

If you’re tweeting about a great new lineup from @seanjohn or a great new episode of @DuckDynastyAE, mention their handle in your tweet. This will ensure that they see your post. Hashtags are great, but they will not get you the direct exposure you receive from @mentions.


BANNERA_guide_to_Mastering_Social_ROI (1)


Read More